R or Python: A Data-Driven Answer
R or Python: A Data-Driven Answer
The question of which programming language to learn is a popular subject among seasoned and aspiring data scientists. R vs. Python is one choice to evaluate among many others, and we have a short and definitive answer: R is considerably better for statistics and visualization, while Python is far better for data extraction, wrangling, and programming. Here is an extract from a short threat on this:
The main distinction between the two languages is in their approach to data science. Both open source programming languages are supported by large communities, continuously extending their libraries and tools. But while R is mainly used for statistical analysis, Python provides a more general approach to data wrangling.
Yet, it would be much more ideal if you can build skills on both of the programming languages. To this end, recently Rstudio is building up tools and environments in/by which data scientist use both of the languages. Here is a short threat on that!
What I am interested, here, is though to provide a data-driven answer for the question of which language is better! For that purpose, I will bring an exert from datacamp projects “Rise and Fall of Programming Languages” by David Robinson.
Project: Rise and Fall of Programming Languages
The aim of the project is to look into the popularity of programming languages through a data derived from Stack Overflow. A list of such question and answer site available at Stack Exchange Data Explorer. With such data in hand, we can ask numerous questions on the popularity of programing languages; even makes much more sense in the discussion between pythonisters and Risters!
Let’s get the required libraries and data first. The data file is available here.
# required libraries
library(tidyverse, ggplot2)
# download data and load it to RStudio
by_tag_year <- read_csv("https://gist.githubusercontent.com/dgrtwo/a30d99baa9b7bfc9f2440b355ddd1f75/raw/700ab5bb0b5f8f5a14377f5103dbe921d4238216/by_tag_year.csv", col_names = T)🚀Each Stack Overflow question has a tag, which marks a question to describe its topic or technology. Through the tags, we can find out which programming languages are most popular!
# to inspect the data
glimpse(by_tag_year)
## Rows: 40,518
## Columns: 4
## $ year <dbl> 2008, 2008, 2008, 2008, 2008, 2008, 2008, 2008, 2008, 2008,…
## $ tag <chr> ".htaccess", ".net", ".net-2.0", ".net-3.5", ".net-4.0", ".…
## $ number <dbl> 54, 5910, 289, 319, 6, 3, 1, 42, 19, 4, 73, 149, 10, 1, 5, …
## $ year_total <dbl> 58390, 58390, 58390, 58390, 58390, 58390, 58390, 58390, 583…This data has one observation for each pair of a tag and a year, showing the number of questions asked in that tag in that year and the total number of questions asked in that year. For instance, there were 54 questions asked about the .htaccess tag in 2008, out of a total of 58390 questions in that year.
Rather than just the counts, we’re probably interested in a percentage: the fraction of questions that year that have that tag. So let’s add that to the table.
# create new column that is franction of whole year numbers
by_tag_year_fraction <- by_tag_year %>%
  mutate(fraction = number/year_total)

#let's list the top 10 programming languages
head(by_tag_year_fraction, 10)
## # A tibble: 10 × 5
## year tag number year_total fraction
## <dbl> <chr> <dbl> <dbl> <dbl>
## 1 2008 .htaccess 54 58390 0.000925
## 2 2008 .net 5910 58390 0.101
## 3 2008 .net-2.0 289 58390 0.00495
## 4 2008 .net-3.5 319 58390 0.00546
## 5 2008 .net-4.0 6 58390 0.000103
## 6 2008 .net-assembly 3 58390 0.0000514
## 7 2008 .net-core 1 58390 0.0000171
## 8 2008 2d 42 58390 0.000719
## 9 2008 32-bit 19 58390 0.000325
## 10 2008 32bit-64bit 4 58390 0.0000685Has R or Python been growing or shrinking?
Let’s look at whether the fraction of Stack Overflow questions that are about R and Python has been increasing or decreasing over time.
r_over_years <- by_tag_year_fraction %>%
  filter(tag %in% c("r", "python"))
Visualizing change over time
Rather than looking at the results in a table, we often want to create a visualization. Change over time is usually visualized with a line plot.
ggplot(r_over_years, aes(x=year, y=fraction, color=tag))+
  geom_line()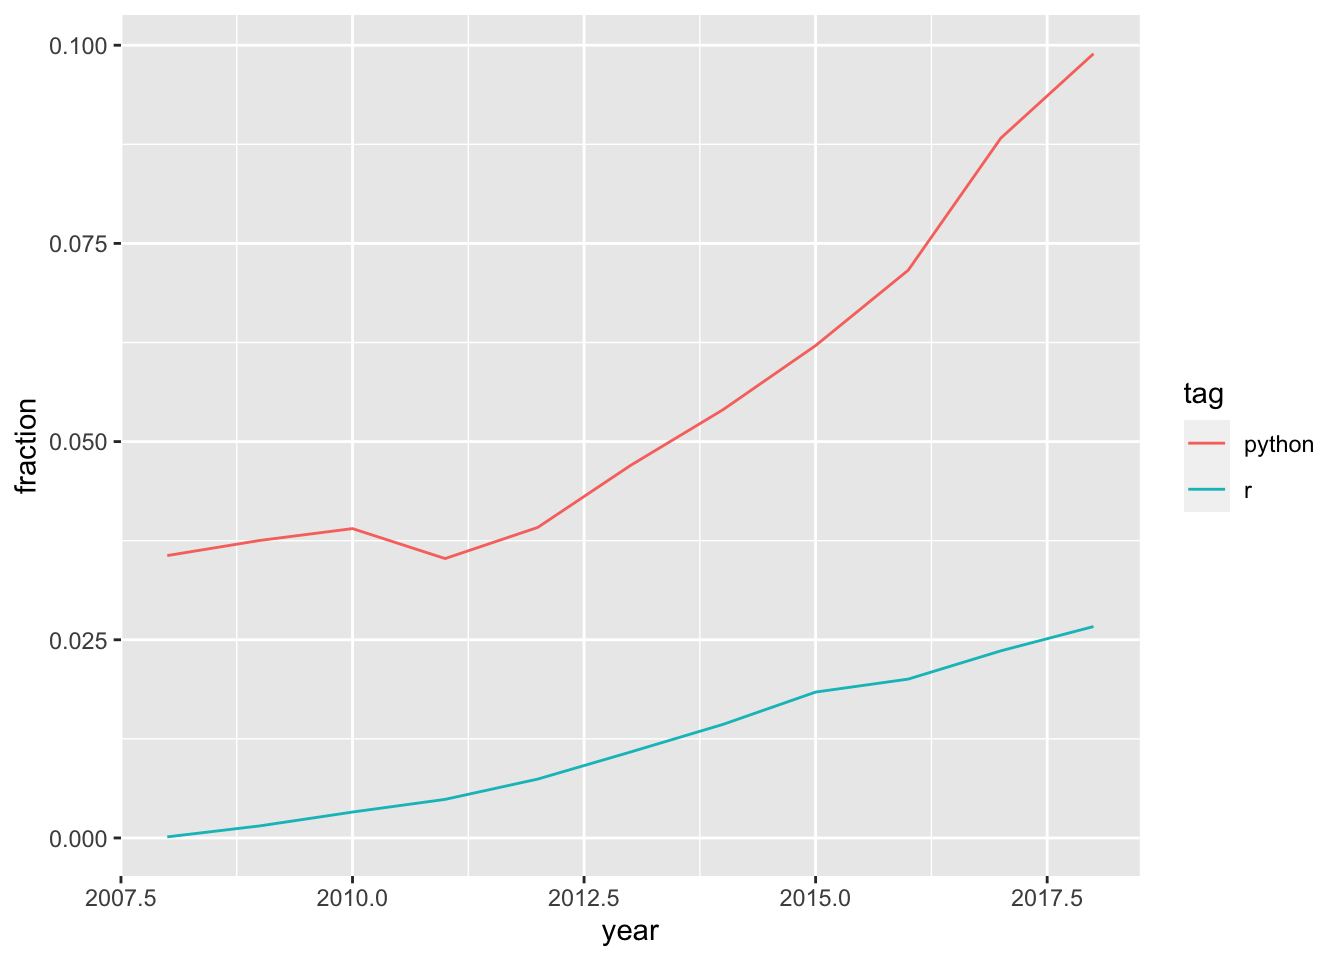
Hakan Mehmetcik
Assoc. Professor
My research interests include social data science with a speciality of International relations